Dashboard
The Dashboard is the first page you see after logging in to UnoPim. It provides a complete overview of your product catalog, activity, and data quality at a glance, helping you quickly understand the state of your PIM and take action where needed.
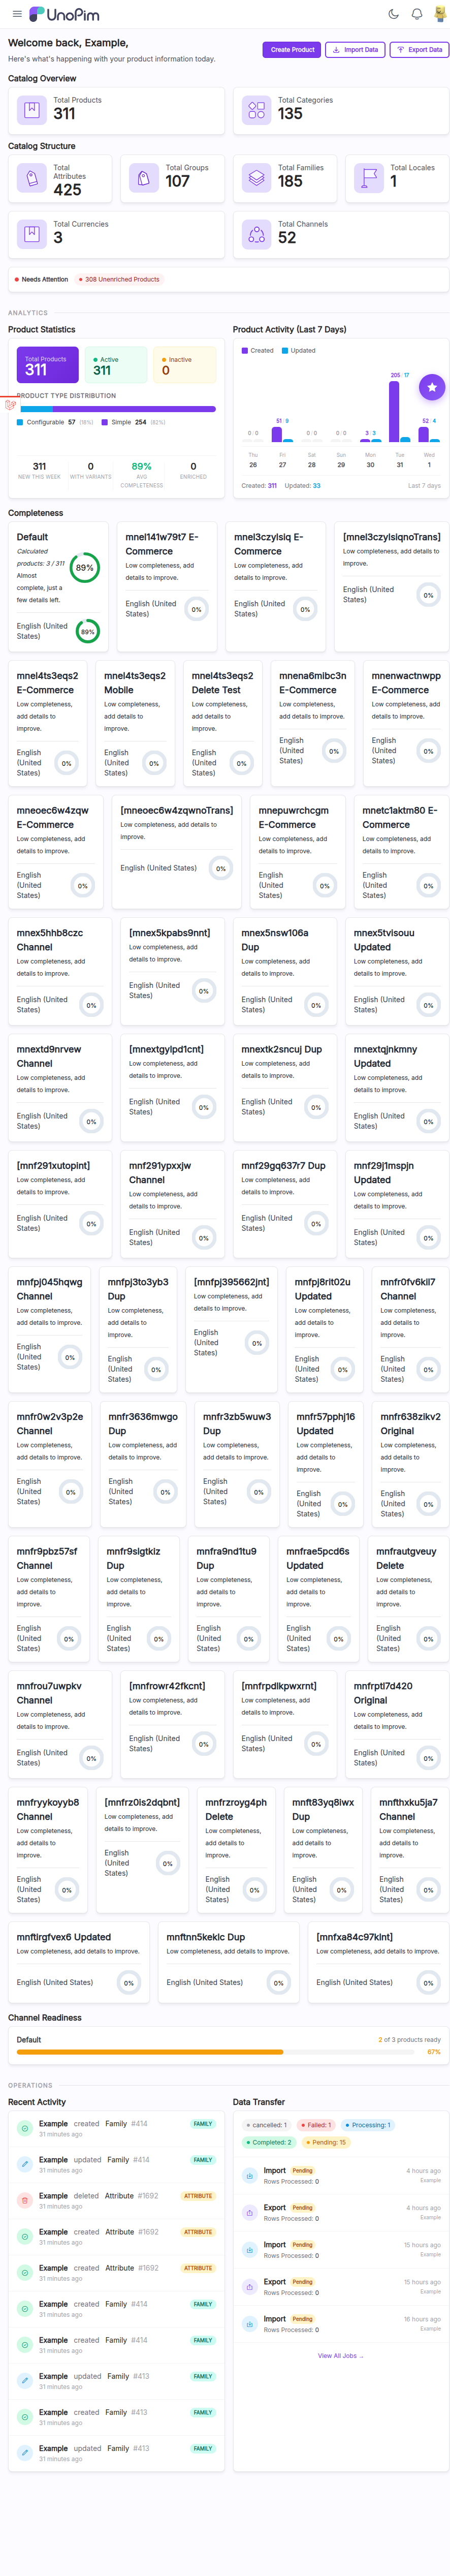
Welcome Banner
At the top of the Dashboard, you will see a personalized greeting: "Welcome back, [Your Name]". This section also provides quick action buttons so you can jump straight into common tasks:
- Create Product - Takes you directly to the product creation page.
- Import Data - Opens the data import workflow.
- Export Data - Opens the data export workflow.
TIP
Use these quick action buttons to save time instead of navigating through the sidebar menu.
Catalog Overview
Below the welcome banner, two summary cards display the total count of your core catalog entities:
- Total Products - Shows the total number of products in your system. Click on this card to navigate directly to the Products listing page.
- Total Categories - Shows the total number of categories. Click on this card to navigate directly to the Categories listing page.
Catalog Structure
This section gives you a quick snapshot of how your catalog is configured. It displays cards for each of the following:
- Total Attributes - The number of product attributes defined in the system.
- Total Groups - The number of attribute groups.
- Total Families - The number of attribute families.
- Total Locales - The number of locales configured.
- Total Currencies - The number of currencies set up.
- Total Channels - The number of sales channels configured.
These cards help you understand the breadth of your catalog setup without navigating to individual settings pages.
Needs Attention
This section highlights items that require your immediate action. If there are unenriched products in your catalog (products that lack essential data), an alert will appear here prompting you to take action and improve your product data quality.
WARNING
Unenriched products may not be ready for distribution to your sales channels. Review this section regularly to ensure your catalog is complete.
Analytics
Product Statistics
The Product Statistics panel provides a detailed numerical breakdown of your catalog:
- Total Products - Overall product count.
- Active / Inactive - How many products are currently enabled vs. disabled.
- Product Type Distribution - Percentage split between configurable and simple product types.
- New This Week - Number of products created in the current week.
- With Variants - Number of products that have variant configurations.
- Avg Completeness - The average completeness score across all products.
- Enriched - Number of products considered fully enriched.
Product Activity (Last 7 Days)
This chart visualizes your team's recent work on the catalog. It plots the number of Created and Updated products per day over the last seven days, making it easy to spot trends in catalog activity.
Completeness
The Completeness section shows how well your product data meets the requirements for each channel. Each channel is displayed with a percentage circle (e.g., 89%) indicating the overall completeness score.
You can also view locale-specific completeness within each channel. Helpful messages are displayed alongside each score:
- "Almost complete" - Your data is nearly ready and only minor additions are needed.
- "Low completeness, add details to improve" - Significant product information is still missing.
TIP
Focus on channels and locales with lower completeness scores first to ensure your products are ready for distribution.
Channel Readiness
The Channel Readiness section shows a progress bar for each channel, indicating how many products are ready for that channel. For example, you might see "2 of 3 products ready" with a 67% progress indicator.
This gives you a clear picture of which channels have complete product data and which ones still need attention.
Operations
Recent Activity
The Recent Activity feed displays a chronological list of actions performed in the system. Each entry includes:
- Action type - Whether an entity was created, updated, or deleted.
- Entity type - The kind of entity affected (e.g., Family, Attribute, Product).
- User name - Who performed the action.
- Timestamp - When the action took place.
This feed helps you track what changes have been made recently and by whom.
Data Transfer
The Data Transfer panel shows the status of your import and export jobs. Each job displays its current status, which can be one of the following:
- Completed - The job finished successfully.
- Processing - The job is currently running.
- Pending - The job is queued and waiting to start.
- Failed - The job encountered errors.
- Cancelled - The job was manually cancelled.
Click on "View All Jobs" to navigate to the full Job Tracker page for more details.
AI Agent
At the bottom right corner of the Dashboard, you will find the "Open Agenting PIM" floating button. Clicking this button opens the AI Agent chat interface, which allows you to interact with UnoPim using natural language commands to manage your catalog, generate content, and perform various tasks.
TIP
The AI Agent can help you quickly create products, enrich content, and answer questions about your catalog without navigating through menus.